Maintaining your privacy is important to us. For this reason, we have developed a Privacy Policy that describes how we use and store your information. Please review our privacy practices and let us know if you have any questions.
Collection and use of personal information
Personal information refers to data that can be used to identify or contact a specific person.
You may be asked to provide your personal information any time you contact us.
Below are some examples of the types of personal information we may collect and how we may use such information.
What personal information do we collect:
- When you submit an application on the site, we may collect various information, including your name, telephone number, address Email etc.
How we use your personal information:
- The personal information we collect allows us to contact you with unique offers, promotions and other events and upcoming events.
- From time to time, we may use your personal information to send important notices and communications.
- We may also use personal information for internal purposes, such as conducting audits, data analysis and various research in order to improve the services we provide and provide you with recommendations regarding our services.
- If you participate in a prize draw, contest or similar promotion, we may use the information you provide to administer such programs.
Disclosure of information to third parties
We do not disclose the information received from you to third parties.
Exceptions:
- If necessary - in accordance with the law, judicial procedure, legal proceedings, and/or based on public requests or requests from government agencies on the territory of the Russian Federation - disclose your personal information. We may also disclose information about you if we determine that such disclosure is necessary or appropriate for security, law enforcement, or other public importance purposes.
- In the event of a reorganization, merger, or sale, we may transfer the personal information we collect to the applicable successor third party.
Protection of personal information
We take precautions - including administrative, technical and physical - to protect your personal information from loss, theft, and misuse, as well as unauthorized access, disclosure, alteration and destruction.
Respecting your privacy at the company level
To ensure that your personal information is secure, we communicate privacy and security standards to our employees and strictly enforce privacy practices.
Class: 7
The function occupies one of the leading places in the school algebra course and has numerous applications in other sciences. At the beginning of the study, for the purpose of motivation and actualization of the question, I inform you that not a single phenomenon, not a single process in nature can be studied, no machine can be constructed and then operate without a complete mathematical description. One tool for this is a function. Its study begins in the 7th grade; as a rule, children do not delve into the definition. Particularly difficult to access concepts are domain of definition and domain of meaning. Using known connections between quantities in problems of movement and value, I translate them into the language of a function, maintaining a connection with its definition. Thus, students develop the concept of function at a conscious level. At the same stage, painstaking work is carried out on new concepts: domain of definition, domain of value, argument, value of a function. I use advanced learning: I introduce the notation D(y), E(y), introduce the concept of zero of a function (analytically and graphically), when solving exercises with areas of constant sign. The earlier and more often students encounter difficult concepts, the better they become aware of them at the level of long-term memory. When studying a linear function, it is advisable to show the connection with the solution of linear equations and systems, and later with the solution of linear inequalities and their systems. At the lecture, students receive a large block (module) of new information, therefore, at the end of the lecture, the material is “wrung out” and a summary is compiled that the students must know. Practical skills are developed in the process of performing exercises using various methods, which are based on individual and independent work.
1. Some information about linear functions.
Linear function very often encountered in practice. The length of the rod is a linear function of temperature. The length of rails and bridges is also a linear function of temperature. The distance traveled by a pedestrian, train, or car at a constant speed is a linear function of travel time.
A linear function describes a number of physical relationships and laws. Let's look at some of them.
1) l = l о (1+at) – linear expansion of solids.
2) v = v о (1+bt) – volumetric expansion of solids.
3) p=p o (1+at) – dependence of the resistivity of solid conductors on temperature.
4) v = v o + at – speed of uniformly accelerated motion.
5) x= x o + vt – coordinate of uniform motion.
Task 1. Determine the linear function from the tabular data:
| X | 1 | 3 |
| at | -1 | 3 |
Solution. y= kx+b, the problem is reduced to solving a system of equations: 1=k 1+b and 3=k 3 + b
Answer: y = 2x – 3.
Problem 2. Moving uniformly and rectilinearly, the body passed 14 m in the first 8 s, and 12 m in another 4 s. Create an equation of motion based on these data.
Solution. According to the conditions of the problem, we have two equations: 14 = x o +8 v o and 26 = x o +12 v o, solving the system of equations, we obtain v = 3, x o = -10.
Answer: x = -10 + 3t.
Problem 3. A car left the city moving at a speed of 80 km/h. After 1.5 hours, a motorcycle came after him, the speed of which was 100 km/h. How long will it take the motorcycle to catch up with him? At what distance from the city will this happen?
Answer: 7.5 hours, 600 km.
Task 4. The distance between two points at the initial moment is 300m. The points move towards each other at speeds of 1.5 m/s and 3.5 m/s. When will they meet? Where will this happen?
Answer: 60 s, 90 m.
Task 5. A copper ruler at 0 o C has a length of 1 m. Find the increase in its length when its temperature increases by 35 o, by 1000 o C (melting point of copper is 1083 o C)
Answer: 0.6mm.
2. Direct proportionality.
Many laws of physics are expressed through direct proportionality. In most cases, a model is used to write these laws
in some cases -
Let's give a few examples.
1. S = v t (v – const)
2. v = a t (a – const, a – acceleration).
3. F = kx (Hooke’s law: F – force, k – stiffness (const), x – elongation).
4. E= F/q (E is the intensity at a given point of the electric field, E is const, F is the force acting on the charge, q is the magnitude of the charge).
As a mathematical model of direct proportionality, you can use the similarity of triangles or the proportionality of segments (Thales’ theorem).
Problem 1. The train passed the traffic light in 5 s, and passed the platform 150 m long in 15 s. What is the length of the train and its speed?
Solution. Let x be the length of the train, x+150 be the total length of the train and platform. In this problem, the speed is constant, and the time is proportional to the length.
We have the proportion: (x+150) :15 = x: 5.
Where x = 75, v = 15.
Answer. 75 m, 15 m/s.
Problem 2. The boat traveled 90 km downstream in some time. In the same time, he would have traveled 70 km against the current. How far will the raft travel during this time?
Answer. 10 km.
Problem 3. What was the initial temperature of the air if, when heated by 3 degrees, its volume increased by 1% of the original.
Answer. 300 K (Kelvin) or 27 0 C.
Lecture on the topic "Linear function".
Algebra, 7th grade
1. Consider examples of problems using well-known formulas:
S = v t (path formula), (1)
C = ck (value formula). (2)
Problem 1. The car drove 20 km from point A and continued its journey at a speed of 62 km/h. At what distance from point A will the car be after t hours? Make up an expression for the problem, denoting the distance S, find it at t = 1 hour, 2.5 hours, 4 hours.
1) Using formula (1) we find the path traveled by a car at a speed of 62 km/h in time t, S 1 = 62t;
2) Then from point A after t hours the car will be at a distance S = S 1 + 20 or S = 62t + 20, let’s find the value of S:
at t = 1, S = 62*1 + 20, S = 82;
at t = 2.5, S = 62*2.5 + 20, S = 175;
at t = 4, S = 62*4+ 20, S = 268.
We note that when finding S, only the value of t and S changes, i.e. t and S are variables, and S depends on t, each value of t corresponds to a single value of S. Denoting the variable S by Y, and t by x, we obtain a formula for solving this problem:
Y= 62x + 20. (3)
Problem 2. In a store we bought a textbook for 150 rubles and 15 notebooks of n rubles each. How much money did you pay for the purchase? Compose an expression for the problem, denoting the cost C, find it for n = 5,8,16.
1) Using formula (2) we find the cost of notebooks C 1 = 15n;
2) Then the cost of the entire purchase is C = C 1 +150 or C = 15n+150, let’s find the value of C:
with n = 5, C = 15 5 + 150, C = 225;
with n = 8, C = 15 8 + 150, C = 270;
with n = 16, C = 15 16+ 150, C = 390.
Similarly, we note that C and n are variables, for each value of n there corresponds a single value of C. Denoting the variable C as Y, and n as x, we obtain a formula for solving problem 2:
Y= 15x + 150. (4)
Comparing formulas (3) and (4), we are convinced that the variable Y is found through the variable x using the same algorithm. We considered only two different problems that describe the phenomena that surround us every day. In fact, there are many processes that change according to the obtained laws, so such a dependence between variables deserves study.
Solutions to problems show that the values of the variable x are chosen arbitrarily, satisfying the conditions of the problems (positive in problem 1 and natural in problem 2), i.e. x is an independent variable (it is called an argument), and Y is a dependent variable and there is a one-to-one correspondence between them , and by definition such a dependence is a function. Therefore, denoting the coefficient of x by the letter k, and the free term by the letter b, we obtain the formula
Y= kx + b.
Definition: Function of the form y= kx + b, where k, b are some numbers, x is an argument, y is the value of the function, called a linear function.
To study the properties of a linear function, we introduce definitions.
Definition 1. The set of admissible values of an independent variable is called the domain of definition of the function (admissible - this means those numerical values of x for which calculations y are performed) and is denoted D(y).
Definition 2. The set of values of the dependent variable is called the domain of the function (these are the numerical values that y takes) and is denoted E(y).
Definition 3. The graph of a function is the set of points on the coordinate plane whose coordinates turn the formula into a true equality.
Definition 4. The coefficient k of x is called the slope.
Let's consider the properties of a linear function.
1. D(y) – all numbers (multiplication is defined on the set of all numbers).
2. E(y) – all numbers.
3. If y = 0, then x = -b/k, point (-b/k;0) – the point of intersection with the Ox axis, is called the zero of the function.
4. If x = 0, then y = b, point (0; b) is the point of intersection with the Oy axis.
5. Let’s find out which line the linear function on the coordinate plane will line up the points, i.e. which is the graph of the function. To do this, consider the functions
1) y= 2x + 3, 2) y= -3x – 2.
For each function we will create a table of values. Let's set arbitrary values of the x variable and calculate the corresponding values of the Y variable.
| X | -1,5 | -2 | 0 | 1 | 2 |
| Y | 0 | -1 | 3 | 5 | 7 |

Having constructed the resulting pairs (x;y) on the coordinate plane and connecting them for each function separately (we took the x values with a step of 1, if we reduce the step, the points will line up more often, and if the step is close to zero, then the points will merge into a solid line ), we notice that the points line up in a straight line in case 1) and in case 2). Due to the fact that the functions are chosen arbitrarily (construct your own graphs y= 0.5x – 4, y= x + 5), we conclude that that the graph of a linear function is a straight line. Using the property of a straight line: there is only one straight line passing through two points, it is enough to take two points to construct a straight line.
6. From geometry it is known that lines can either intersect or be parallel. Let's study the relative position of graphs of several functions.
1) y= -x + 5, y= -x + 3, y= -x – 4; 2) y= 2x + 2, y= x + 2, y= -0.5x + 2.
Let's build groups of graphs 1) and 2) and draw conclusions.
|
 |

The graphs of functions 1) are located in parallel, examining the formulas, we notice that all functions have the same coefficients for x.
The graphs of functions 2) intersected at one point (0;2). Examining the formulas, we notice that the coefficients are different, and the number b = 2.
In addition, it is easy to notice that straight lines defined by linear functions with k › 0 form an acute angle with the positive direction of the Ox axis, and an obtuse angle with k ‹ 0. Therefore, the coefficient k is called the slope coefficient.
7. Let's consider special cases of a linear function, depending on the coefficients.
1) If b=0, then the function takes the form y= kx, then k = y/x (the ratio shows how many times the difference or what part y is from x).
A function of the form Y= kx is called direct proportionality. This function has all the properties of a linear function, its peculiarity is that for x=0 y=0. The direct proportionality graph passes through the origin point (0;0).
2) If k = 0, then the function takes the form y = b, which means that for any value of x the function takes the same value.
A function of the form y = b is called constant. The graph of the function is a straight line passing through the point (0;b) parallel to the Ox axis; at b=0, the graph of the constant function coincides with the abscissa axis.
Abstract
1. Definition A function of the form Y = kx + b, where k, b are some numbers, x is an argument, Y is the value of the function, is called a linear function.
D(y) – all numbers.
E(y) – all numbers.
The graph of a linear function is a straight line passing through the point (0;b).
2. If b=0, then the function takes the form y= kx, called direct proportionality. A direct proportionality graph passes through the origin.
3. If k = 0, then the function takes the form y= b and is called constant. The graph of a constant function passes through the point (0;b), parallel to the abscissa axis.
4. Mutual arrangement of graphs of linear functions.
The functions y= k 1 x + b 1 and y= k 2 x + b 2 are given.
If k 1 = k 2, then the graphs are parallel;
If k 1 and k 2 are not equal, then the graphs intersect.
5. See above for examples of graphs of linear functions.
Literature.
- Textbook Yu.N. Makarychev, N.G. Mindyuk, K.I. Neshkov and others. “Algebra, 8.”
- Didactic materials in algebra for 8th grade / V.I. Zhokhov, Yu.N. Makarychev, N.G. Mindyuk. – M.: Education, 2006. – 144 p.
- Supplement to the newspaper September 1 “Mathematics”, 2001, No. 2, No. 4.
"Linear function". 7th grade
Goals:
Educational:
Repeat, generalize, consolidate, test knowledge and skills on the topic “Linear function”;
To develop the ability to synthesize and generalize acquired knowledge in mathematics and physics lessons.
Educational:
Development of skills in constructing graphs of the function y = kx + b;
Development logical thinking, initiative, independence;
Development of skills to analyze and draw conclusions.
Educational:
Cultivate neatness, graphic culture, and speech culture;
Develop the ability to work in groups, listen to the opinion of a partner.
Equipment:
Handout;
Multimedia - projector;
Computer.
Lesson type: generalizing.
Form of work: frontal
DURING THE CLASSES.
1. Organizing time. (Slide No. 2)
The teacher announces the topic of the lesson.
2. Setting objectives and goals for the lesson. (Slide No. 3)
The teacher and students formulate the goals and objectives of the lesson.
3. Reflection. (Slide No. 4).
Teacher: Choose from the proposed drawings the one that matches your mood at the beginning of the lesson and mark it.
If you feel good, you are ready to learn new material and you think that all the questions will be clear to you, then choose the happy emoticon.
If you are worried that you are not prepared enough to learn new material and are worried that not all the questions will be clear to you, then choose the sadness emoji.
If you are worried that you are not at all ready to learn new material and most of the questions will not be clear to you, then choose a crying emoticon.
CHECKING YOUR HOMEWORK
4. Oral repetition of key algebra questions.
Frontal work with the class . (Slide No. 5).
Which function is called linear?
Its domain of definition?
Under what condition does a linear function become directly proportional?
What is the graph of a linear function and direct proportionality?
How to graph a linear function (direct proportionality)?
What causes the difference in the graphs of these functions?
What types of linear function y = kx + b do you know? (Slide No. 6)
5. Independent work.
Students are asked to complete the following assignments in writing in the form of a test. (Slides No. 7 - 15)
When taking the test, students fill out an answer sheet. (See Attachment).
Which function's graph is redundant? (Slide No. 8)
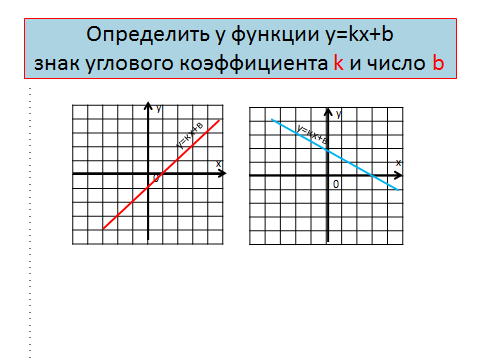
In which figure is the coefficient k in the equation of a linear function negative? (Slide No. 9)
In which figure is the free term b in the equation of a linear function positive?
(Slide number 10)
Write down equations for the lines shown in the pictures. (Slide No. 11)
Which figure shows the graph of direct proportionality y = kx? Explain the answer.
(Slide No. 12)
A student made a mistake when plotting a graph of one function. In what picture?
(Slide No. 13)
The figure shows the graphs of the functions: y = 3x, y = - 3x, y = x – 3. What number is the graph of the function y = -3x shown under? (Slide No. 14)
Use the formula to define a linear function whose graph is parallel to the straight line y = -8x + 11 and passes through the origin. (Slide number 15)
The completed work is checked. (Slides No. 16 – 24))
6. Working with the class.
Create a mathematical model to solve the problem. (Slide No. 25)
There is always a certain number of bacteria in the human body, about 10 thousand of them. During a flu epidemic, if the patient does not take antibiotics, the number of bacteria in the body increases by 50 thousand every day.
How many bacteria will be in the human body after 3 days, after 4 days?
Write the formula in your notebook and answer the following questions:
Will this relationship be linear?
What can you say about the behavior of the graph of this function?
Construct this graph in your notebook.
Students complete this task independently. After this, the decision is discussed with all students. (Slide No. 26)
WORKING WITH CARDS
7. Mathematics is an applied science and now you will consider the application of a linear function in other sciences and areas of our life.
Working with the class.
Problems on the application of linear functions in physics are considered. (Slides No. 27 - 32)
Problems are considered in
Anatomy (Slides No. 47 - 48).
Psychology (Slides No. 49 - 51).
PHYSICAL MINUTE
WORK IN PAIRS
Criminology (Slides No. 52 - 54).
Economics (Slides No. 55 - 56).
In everyday life (Slides No. 57 - 58).
Conclusion .
So, today in class we looked at the use of linear functions in various sciences and fields of activity (Slide No. 59)
9. Expanding your horizons - report from one of the children
Students are asked to think about the following activity: What happens inside when you open the door lock? (Slide No. 60 – 61)
(This task is offered to students as homework for a group of strong students)
After this, one of the students in this group talks about the ongoing process.
It turns out that arithmetic operations can be applied to functions according to certain rules and under certain conditions. I'll give you a very clear example, where there is a need to apply actions to functions.
Look at the picture. Do you know how to open a door with such a key? What happens inside when you open the door lock? In order for the lock to open, you need to turn the drum in which the keyhole is made. But this is prevented by pins standing closely inside the well, sliding up and down. Each of the pins must be raised to such a height that their upper ends are flush with the surface of the drum. This makes the key.
From the point of view of mathematics, all this mechanics is nothing more than the operation of adding two functions. One of them is the profile of the key, the other is the line outlining the upper ends of the pins when the lock is locked. The secret of the door lock is that as a result of adding two functions, a constant function is obtained, the constant value of which is equal to the diameter of the drum.

10. Summing up the lesson. (Slides No. 62 - 63).
Teacher: Let's repeat it again.
What new things have you learned?
What have you learned?
What did you find particularly difficult?
11. Homework. (Slide No. 64).
12. Reflection:
Teacher: You can show what mood you are in when you leave the lesson by choosing an emoticon. (Slide No. 65)
Teacher: Lesson is over! All the best!
Thank you for the lesson. (Slide No. 66)
13. Literature:
Textbook “Algebra – 7”, Yu.N. Makarychev, N.G. Mindyuk, K.I. Neshkov, S.B. Suvorov, Moscow, “Enlightenment”, 2009.
Textbook “Physics – 7”, N.V. Peryshkin, Moscow, Bustard, 2009.
“Collection of problems in physics for grades 7 – 9”, V.I. Lukashik, E.V. Ivanova, Moscow, “Enlightenment”, 2008.
Frontal laboratory classes in physics in grades 7-11, Moscow, “Enlightenment”,
2008
Internet resources.
Lesson summary
Certified teacher: Elena Nikolaevna Sindeeva___________________________________________
Subject: Algebra______________________________Grade 7_____________________________________________
Lesson topic: “Graphs of linear functions.”__________________________________________________________
Objectives of studying the topic:
Meta-subject (developmental):
Communicative: create conditions for the development of communication skills;
Regulatory: create conditions for the development of skills to analyze, compare, and draw conclusions; to demonstrate initiative and independence;
Cognitive: create conditions for developing skills in working with ready-made tests;
Subject (educational): promote the assimilation of the relative position of graphs of linear functions;
create conditions for developing skills in applying acquired knowledge.
Personal (educational): promote a positive attitude towards academic work; skill
express your point of view and listen to others.
Lesson Objectives:
Check your homework.
Repeat theoretical material on the previous topic.
Strengthen the ability to work according to ready-made schedules.
Develop the ability to observe, analyze, and draw conclusions.
Check your understanding of the material.
Lesson type: primary consolidation of new knowledge.
Educational and didactic support for the lesson and teaching aids:, tests, individual cards, tables, presentation.
| Stages of work | (to be filled in by the teacher) |
|
| Organizing time, including: setting a goal that must be achieved by students at this stage of the lesson (what must be done by students in order for their further work in the lesson to be effective) description of methods for organizing students’ work at the initial stage of the lesson, setting students up for learning activities, the subject and topic of the lesson (taking into account the real characteristics of the class with which the teacher works) | Teacher: Hello, guys! Today we will continue our work on studying the relative positions of graphs of linear functions. We must study the relative positions of graphs of linear functions and be able to apply them in practice. The purpose of the lesson stage: To promote a positive attitude towards educational work, the ability to express one’s point of view and listen to someone else’s. Didactic objectives of the lesson stage: Get into the business rhythm, prepare for work, develop communication skills, develop the ability to analyze an action plan. Method of organizing students' work: Oral communication from the teacher. Form of organization educational activities: Conversation. Teacher: Today we are working using images on the TV screen, please follow the rules of conduct in class. Everyone has a sheet of paper on their desk with a lesson plan where you will make your suggestions. Try to work actively. At the end of the lesson, please indicate your attitude towards the lesson and indicate your mood. Teacher's activity: Voices the topic, plan and purpose of the lesson. Student activity: Analyze and comment on the lesson plan. Teacher: Guys, here is a lesson plan, analyze it and make your suggestions. Lesson plan: Oral work. Working with cards. Checking homework. Oral completion of tasks on the topic, according to ready-made schedules. Independent work on options in pairs. Executing the test. Summarizing. Homework. Result: Students analyze the lesson plan and make their suggestions. |
|
| Survey of students on homework assignments, including: determining the goals that the teacher sets for students at this stage of the lesson (what result should be achieved by students); determining the goals and objectives that the teacher wants to achieve at this stage of the lesson; description of methods that contribute to solving set goals and objectives; description of the criteria for achieving the goals and objectives of this stage of the lesson; determining possible actions of the teacher if he or the students fail to achieve their goals; a description of methods for organizing joint activities of students, taking into account the characteristics of the class with which the teacher works; description of methods of motivating (stimulating) students' learning activity during the survey; description of methods and criteria for assessing student responses during the survey. | Teacher: 3 people work at the board, solving examples from homework: I: y=-4x-1 and y=2x+5 II: y=-2x+3 and y=x-6 A) parallel to the graph of the function B)parallel to the graph of the function and passes through the origin B) intersects with the graph of the function D) intersects with the graph of the function at point A(0;-42) 2 people work using cards. (Annex 1) The purpose of the lesson stage: To create conditions for the development of skills to analyze, compare, draw conclusions, to show initiative and independence. Didactic objectives of the lesson stage: Identify the level of knowledge on homework, determine typical mistakes, perform knowledge correction. Method of organizing students' work: Self-analysis, self-assessment. Form of organization of educational activities: Individual cards, work at the board, conversation. Teacher's activities: Offers tasks using cards, organizes a conversation using previously studied material. Student activity: Solve the task on the card, answer questions from the teacher and students. Result: Students find the coordinates of the intersection points of graphs of linear functions, explaining what additional knowledge was used. The rest of the guys correct mistakes and complete the answers. Those who answer at the board receive a mark. Teacher: While the guys are solving problems on the board, we will repeat the main points we learned in the last lesson and answer questions orally. The purpose of the lesson stage: To activate the students’ knowledge necessary to complete the test. Didactic tasks of the lesson stage: repeat the concepts of function, graph of a function, consolidation geometric meaning coefficient k And b functions y = kx + b; relative position of graphs of linear functions. Activities of the teacher: asks questions, monitors the correctness of the answer, and corrects incorrect answers together with the students. Student activity: Answer questions: (Appendix 2. Presentation. Slides 5,6,7) Method of organizing students' work: Partial search. Form of organization of educational activities: Frontal work. What function is called linear? What is the graph of a linear function? How many points on the plane do you need to mark to construct a straight line? How to graph a linear function? What function is called direct proportionality? What is a direct proportionality graph? In which coordinate quarters is the graph of the function y=k x at k0‚k located? What is k called? What depends on k on the graph? What can be the relative position of two straight lines on a plane?
Result: Questions answered. Teacher: let's check the correctness of the homework (Slide 9, 10, 11), work on the cards, well done guys, they did everything right. Now let’s all solve the next task together. Write down the number 1.11.13, class work and the topic of the lesson: Generalization of the topic - the relative position of the graphs of a linear function. Assignment: (Appendix 1. Presentation. Slide 13)
Among the functions, given by formulas y=x+0.5 (1) ; y=-0.5x+4 (2) ; y=5x-1 (3) ; y=1+0.5x (4) ; y=2x-5 (5); y=0.5x-2 (6) name those whose graphs a)parallel to the graph of the function y=0.5x+4 b) intersects with the graph of the function y=2x+3 c) coincides with the graph of the function y=4-0.5x The purpose of the lesson stage: To form a cognitive motive. Upbringing personal qualities students (kindness, attention, helping those in need). Didactic tasks of the lesson stage: Organize students to accept a cognitive task. Method of organizing students' work: Creating a problem situation. Form of organization of educational activities: Problem-dialogue. Teacher's activity: Creates a problematic situation to find the correct answer to the question asked. Student activity: Analyze the task, outline a plan completing the task, |
|
| Physical education minute. Goal: Prevent fatigue. | The purpose of the lesson stage: Create conditions to prevent fatigue. Without turning your head, look up-down-right-left and close your eyes. “YES” - extend your arms up “NO” - extend your arms forward “I DON’T KNOW” - extend your arms to the sides. Are the following statements true: 1.The graph of direct proportionality passes through the origin, 2.The function argument is the dependent variable, 3. To build a graph of a linear function, two points are enough, 4.If k 1 = k 2, then the graphs of linear functions intersect, 5. The formula y=6/x defines a linear function. |
|
| Consolidation educational material , suggesting: setting a specific educational goal for students (what result should be achieved by students at this stage of the lesson); determining the goals and objectives that the teacher sets for himself at this stage of the lesson; description of forms and methods of achieving set goals during the consolidation of new educational material, taking into account individual characteristics students with whom the teacher works. a description of the criteria to determine the degree to which students have mastered new educational material; A description of possible ways and methods of responding to situations when the teacher determines that some students have not mastered the new educational material. | The purpose of the lesson stage: To promote a positive attitude towards academic work, to create conditions for the development of skills to analyze, compare, draw conclusions, to show initiative and independence, to develop skills in applying acquired knowledge. Didactic tasks of the lesson stage: Identify the level of mastery of the material, adjust knowledge, organize activities to apply knowledge in a changed situation, analyze the success of mastering the material. Method of organizing students' work: Independent work in the form of a test. (Appendix 3) Form of organization of educational activities: individual work, work in pairs. Activities of the teacher: advises students on how to complete the test, organizes verification of exercises, focuses students’ attention on the final results of the activity, asks questions about achieving the goal of the lesson, sums up the lesson. Student activities: perform a test, carry out mutual testing, correct knowledge using the theory of a given paragraph of the textbook, analyze the work of friends, answer the teacher’s questions when summing up the lesson. Result: Students complete the test, rate their deskmate, and sort out all the questions and problems that arise. Teacher: !. What did we learn in class today? 2. Why do we need to know the relative positions of the graphs of linear functions? 3. When will we need this? Lesson result: summing up, achieving the lesson goal, marking. |
|
| Homework assignment, including: setting goals independent work for students (what students should do while doing homework); determining the goals that the teacher wants to achieve by assigning homework; defining and explaining to students the criteria for successfully completing homework. | The purpose of the lesson stage: Together with the students, determine a plan for completing homework, give the necessary explanations, and check the corresponding entry in the diaries. Didactic objectives of the lesson: Understand the content and methods of completing homework. Method of organizing students' work: Verbal. Form of organization of educational activities: Consultation. Teacher's activities: Gives comments on homework. Student activity: Write down the task in the diary. Homework: Having a list of 10 tasks on the topic of the chapter and more (in 2 versions), (Appendix 4) The students' task is to have an idea of the upcoming test work, complete those of the proposed tasks that, in the opinion of students, are most necessary for their preparation. Result: Write down the task in the diary, listen to the teacher’s comments, ask questions. |


APPENDIX No. 1
CARD No. 1
1. The equation of the straight line has the form y = kx + b. For the function y = 8 + 2x, write what are the values of k and b?
2. Construct graphs of the functions y = 3 and y = -x in one coordinate system.
CARD No. 2
What is the name of the function y = 2x - 3?
Construct graphs of the functions y = x + 2 and y = x in one coordinate system.
APPENDIX No. 3
OPTION 1
a) y=2x-1 and y=2x+3
A) intersect
B) parallel
B) coincide
b) y=3x+2 and y=2x-3
A) intersect
B) parallel
B) coincide
c)y=0.5x+ and y=0.75 +x
A) intersect
B) parallel
B) coincide
a) y = 12x -8 and y = ?x + 4 intersected
c) y = 12x – 8 and y = ?x – ? coincided.
OPTION 2
1. Without performing construction, determine the relative position of the function graphs:
a) y=6x-1 and y=4x+5
A) intersect
B) parallel
B) coincide
b) y=x-0.5 and y=- +0.6x
A) intersect
B) parallel
B) coincide
c)y=0.5x+2 and y=0.5x -4
A) intersect
B) parallel
B) coincide
2. Select and insert a number instead of the question mark so that the graphs of the functions:
a) y = -27x+1 and y = ?x -9 intersected
c) y = -27x+1 and y = ?x – ? coincided.
3. Create a function for the graph shown in the figure:
APPENDIX No. 4
Option I.
1. Reduce the fraction:
a B C)
2. Graph Equation 3 X + at+1 = 0. Does point A (; -3) belong to him?
3. Graph the linear function y = -2x + 1.
Use the graph to find:
a) the largest and smallest value functions on the interval [-1; 2];
b) variable values X, at which at = 0, at
4. Rearrange Equation 2 X – at– 3 = 0 to the form of a linear function y =kx + m. What are they equal to? k And m?
5. Find the largest and smallest values of linear function 2 X – at– 3 = 0 on the segment [-1; 2].
3X + 2at- 6 = 0 with coordinate axes;
b) determine whether point K (; 3.5) belongs to the graph of this equation.
at = 3 - X And at = 2X.
y =kx +
m k And m?
y =kx formula if it is known that its graph is parallel to the line -3 X + at – 4 = 0.
10. At what value R solving equation 5 X + RU – 3R= 0 is a pair of numbers (1;1)
Option II.
1. Reduce the fraction:
a B C)
2. Graph Equation 2 X - at– 3 = 0. Does point A (; 2) belong to him?
3. Graph the linear function y = 2x - 3.
Use the graph to find:
a) the largest and smallest values of the function on the segment [-2; 1];
b) variable values X, at which at = 0, at 0.
4. Rearrange Equation 3 X + at– 2 = 0 to the form of a linear function y =kx + m. What are they equal to? k And m?
5. Find the largest and smallest values of linear function 3 X + at– 2 = 0 on the segment [-1; 1].
6. a) Find the coordinates of the intersection point of the graph of the linear equation
2X - 5at- 10 = 0 with coordinate axes;
b) determine whether point M (-; -2.6) belongs to the graph of this equation.
7. Find the coordinates of the point of intersection of the lines at = - X And at = X - 2.
8. The figure shows a graph of a linear function y =kx +
m. What are the coefficient values? k And m?
9. a) Define a linear function y =kx formula if it is known that its graph is parallel to the line 4 X + at + 7 = 0.
b) Determine whether the given function is increasing or decreasing. Explain your answer.
10. At what value R solving the equation - px + 2у + R= 0 is a pair of numbers (-1;2)
Full name of educational institution:
Secondary municipal educational institution comprehensive school No. 3 of the village of Kochubeevskoye, Stavropol Territory
Subject area: mathematics
Lesson title: “Linear function, its graph, properties.”
Age group: 7th grade
Presentation title:“Linear function, its graph, properties.”
Number of slides: 37
Environment (editor) in which the presentation was made: Power Point 2010
This presentation
1 slide – title
Slide 2 - updating of background knowledge: definition of a linear equation, orally select those that are linear from those proposed.
Slide 3 - definition of a linear function.
4 slide recognition of a linear function from those proposed.
5 slide - conclusion.
6 slides - ways to set a function.
Slide 7 I give an example and show.
Slide 8 - I give an example and show it.
9 slide task for students.
Slide 10 - checking the correctness of the task. I draw students’ attention to the relationship between the coefficients k and b and the location of the graphs.
11 slide output.
Slide 12 - working with the graph of a linear function.
13 slides Tasks for independent decision: build graphs of functions (do it in a notebook).
Slides 14-17 - showing the correct execution of the task.
Slides 18-27 are oral and written tasks. I don’t choose all tasks, but only those that are suitable for the level of readiness of the class.if there is time.
28 slide task for strong students.
29 slides - let's summarize.
30-31 slides - conclusions.
Slides 32-36 - historical background. (subject to time availability)
Slide 37 - Used literature
List of used literature and Internet resources:
1.Mordkovich A.G. and others. Algebra: textbook for 7th grade educational institutions– M.: Education, 2010.
2. Zvavich L.I. and others. Didactic materials on algebra for grade 7 - M.: Prosveshchenie, 2010.
3. Algebra 7th grade, edited by Makarychev Yu.N. et al., Education, 2010.
4. Internet resources:www.symbolsbook.ru/Article.aspx%...id%3D222
Preview:
To use presentation previews, create a Google account and log in to it: https://accounts.google.com
Slide captions:
Linear function, its graph, properties. Kiryanova Marina Vladimirovna, mathematics teacher, Municipal Educational Institution Secondary School No. 3, village. Kochubeevskoye, Stavropol Territory
Specify linear equations: 1) 5y = x 2) 3y = 0 3) y 2 + 16x 2 = 0 4) + y = 4 5) x + y =4 6) y = -x + 11 7) + 0.5x – 2 = 0 8) 25d – 2m + 1 = 0 9) y = 3 – 2x 5
A function of the form y = kx + b is called linear. The graph of a function of the form y = kx +b is a straight line. To construct a straight line, only two points are needed, since only one straight line passes through two points.
Find equations of linear functions y =-x+0.2; y= 1 2 , 4x-5.7 ; y =- 9 x- 1 8; y=5.04x; y =- 5.04x; y=1 26 .35+ 8 .75x; y=x -0, 2; y=x:8; y=0.00 5x; y=13 3 ,13 3 13 3 x; y= 3 - 1 0 , 01x ; y=2: x ; y = -0.004 9; y= x:6 2 .
y = kx + b – linear function x – argument (independent variable) y – function (dependent variable) k, b – numbers (coefficients) k ≠ 0
x X 1 X 2 X 3 y U 1 U 2 U 3
y = - 2x + 3 – linear function. The graph of a linear function is a straight line, to construct a straight line you need to have two points x - an independent variable, so we will choose its values ourselves; Y is a dependent variable; its value is obtained by substituting the selected value of x into the function. We write the results in the table: x y 0 2 If x = 0, then y = - 2 0 + 3 = 3. 3 If x=2, then y = -2 · 2+3 = - 4+3= -1. - 1 Mark the points (0;3) and (2;-1) on the coordinate plane and draw a straight line through them. x y 0 1 1 Y= - 2x+3 3 2 - 1 we choose ourselves
Construct a graph of the linear function y = - 2 x +3 Let's make a table: x y 03 1 1 Let's construct points (0; 3) and (1; 5) on the coordinate plane and draw a line through them x 1 0 1 3 y
I option II option y=x-4 y =- x+4 Determine the relationship between the coefficients k and b and the location of the lines Plot a graph of a linear function
y=x-4 y=-x+4 I option II option x y 1 2 0 -4 x 1 2 0 4 y
x 0 y y = kx + m (k > 0) x 0 y y = kx + m (k 0, then the linear function y = kx + b increases if k
Using the graph of the linear function y = 2x - 6, answer the questions: a) at what value of x will y = 0? b) at what values of x will y 0? c) at what values of x will y 0? 1 0 3 y 1 x -6 a) y = 0 at x = 3 b) y 0 at x 3 If x 3, then the straight line is located above the x axis, which means the ordinates of the corresponding points of the straight line are positive c) y 0 at x 3 If x 3, then the line is located below the x axis, which means that the ordinates of the corresponding points of the line are negative
Tasks for independent solution: build graphs of functions (do it in a notebook) 1. y = 2x – 2 2. y = x + 2 3. y = 4 – x 4. y = 1 – 3x Please note: the points you choose to construct a straight line may be different, but the location of the graphs must coincide
Answer to task 1
Answer to task 2
Answer to task 3
Answer to task 4
Which figure shows the graph of the linear function y = kx? Explain the answer. 1 2 3 4 5 x y x y x y x y x y
The student made a mistake when graphing a function. In what picture? 1. y =x+2 2. y =1.5x 3. y =-x-1 x y 2 1 x y 3 1 x y 3 3
1 2 3 4 5 x y x y y x y x y In which picture is the coefficient k negative? x
State the sign of the coefficient k for each of the linear functions:
In which figure is the free term b in the equation of a linear function negative? 1 2 3 4 5 x y x y x y x y x y
Select the linear function whose graph is shown in the figure y = x - 2 y = x + 2 y = 2 – x y = x – 1 y = - x + 1 y = - x - 1 y = 0.5x y = x + 2 y = 2x Well done! Think about it!
x y 1 2 0 1 2 3 -1 -2 -1 -2 x y 1 2 0 1 2 3 -1 -2 -1 -2 y=2x y=2x+ 1 y=2x- 1 y=-2x+ 1 y = - 2x- 1 y =-2x
y=-0.5x+ 2 , y=-0.5x , y=-0.5x- 2 x y 1 2 0 1 2 3 -1 -2 -1 -2 3 4 5 6 -3 x y 1 2 0 2 3 -1 -2 -1 -2 3 4 5 6 -3 1 y=0.5x+ 2 y=0.5x- 2 y=0.5x y=-0.5x+ 2 y=-0.5x y =-0 .5x- 2
y=x+ 1 y=x- 1 , y=x y 1 2 0 1 2 3 -1 -2 -1 -2 3 4 5 6 -3 x y 1 2 0 1 2 3 -1 -2 -1 -2 3 4 5 6 -3 x y=-x y=-x+ 3 y =-x- 3 y=x+ 1 y=x- 1 y=x
Create an equation for a linear function using the following conditions:
summarize
Write down your conclusions in your notebook. We learned: *A function of the form y = kx + b is called linear. * The graph of a function of the form y = kx + b is a straight line. *To construct a straight line, only two points are needed, since only one straight line passes through two points. *Coefficient k shows whether the straight line is increasing or decreasing. *Coefficient b shows at what point the straight line intersects the OY axis. *Condition of parallelism of two lines.
I wish you success!
Algebra - this word comes from the title of the work of Muhammad Al-Khorezmi “Aljabr and Almuqabala”, in which algebra was presented as an independent subject
Robert Record is an English mathematician who in 1556. introduced the equal sign and explained his choice by the fact that nothing can be more equal than two parallel segments.
Gottfried Leibniz was a German mathematician (1646 – 1716), who was the first to introduce the term “abscissa” in 1695, “ordinate” in 1684, and “coordinates” in 1692.
Rene Descartes - French philosopher and mathematician (1596 - 1650), who first introduced the concept of “function”
Used literature 1. Mordkovich A.G. and others. Algebra: textbook for 7th grade of general education institutions - M.: Prosveshchenie, 2010. 2. Zvavich L.I. and others. Didactic materials on algebra for grade 7 - M.: Education, 2010. 3. Algebra 7th grade, edited by Makarychev Yu.N. and others, Education, 2010. 4. Internet resources: www.symbolsbook.ru/Article.aspx %...id%3D222